
Essential Guide to Day Trading Indicators
Achieving a professional status as a day trader is no small feat, requiring discipline, impeccable risk and money management skills, and a profound understanding of the market. A comprehensive grasp of various technical indicators is crucial to ascend to the top echelons. These indicators not only offer technical analysis of market conditions but also insights into market psychology and the supply and demand of securities. They even provide reliable predictions based on intricate computations.
For beginners, navigating the interpretation of indicators and deciding which ones to employ can be overwhelming. To assist, here’s a brief overview of some of the top indicators for day trading.
First and foremost, one of the most prevalent indicators on a professional trader’s chart is the moving average. This indicator evaluates the overall trend direction, forming the foundation for analysis. It helps assess potential support and resistance levels and comes in two types: the simple moving average (SMA) and exponential moving average (EMA).
The choice between the two depends on the time frame under scrutiny. Traders often use both to make comparisons, aiding in determining whether the stock is in an uptrend or downtrend. Professionals often favor the EMA indicator due to potential drawbacks with the SMA. The SMA assigns equal weightage to all price points, potentially leading to redundancy.
Another frequently employed indicator is the on-balance volume (OBV) indicator, measuring the flow of positive and negative volume in a security over time. It verifies trend strength and validates potential breakouts and breakdowns by keeping a running total of up volume minus down volume.
Lastly, the relative strength index (RSI) is a valuable tool for gauging momentum and trend strength. Plotting recent price gains versus losses in a range of zero to 100, the RSI indicates overbought or oversold conditions for an asset. A rise above 70 suggests overbought conditions, signaling a potential decline, while a fall below 30 indicates oversold conditions, suggesting a time to buy or allow existing stock to rally. RSI is versatile, used for measuring divergence and evaluating support and resistance levels.
These examples merely scratch the surface of the top indicators that traders should have in their toolkits. For more in-depth insights, continue reading below!
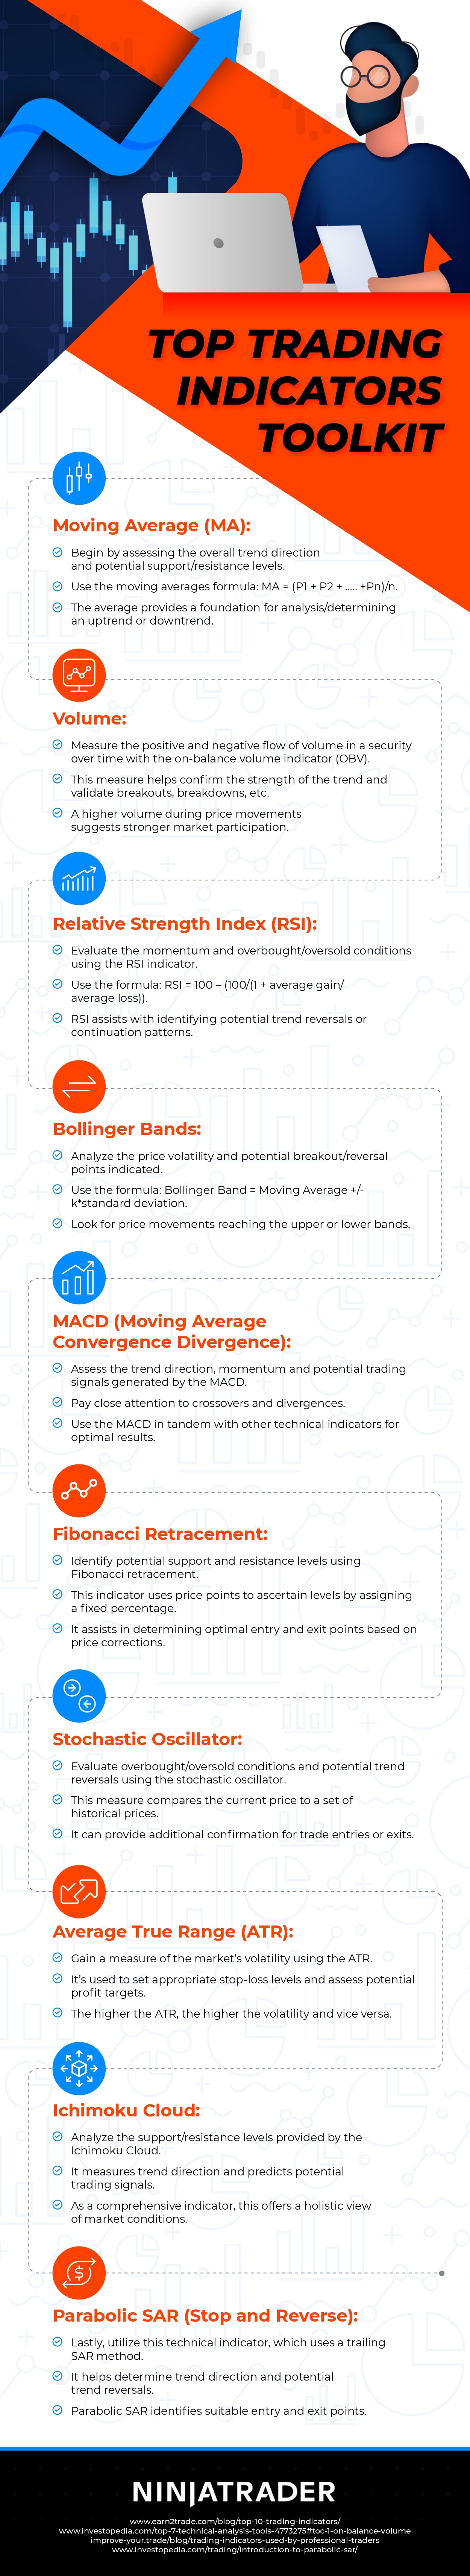
Top Trading Indicators Toolkit from NinjaTrader, a futures broker